
Social Media Statistics January to March 2017
By Sigrid Suski on 2017-04-06 15:19 in Social Media Team
Social Media Statistics January to March 2017
The insight tools of the social media accounts we manage are different.
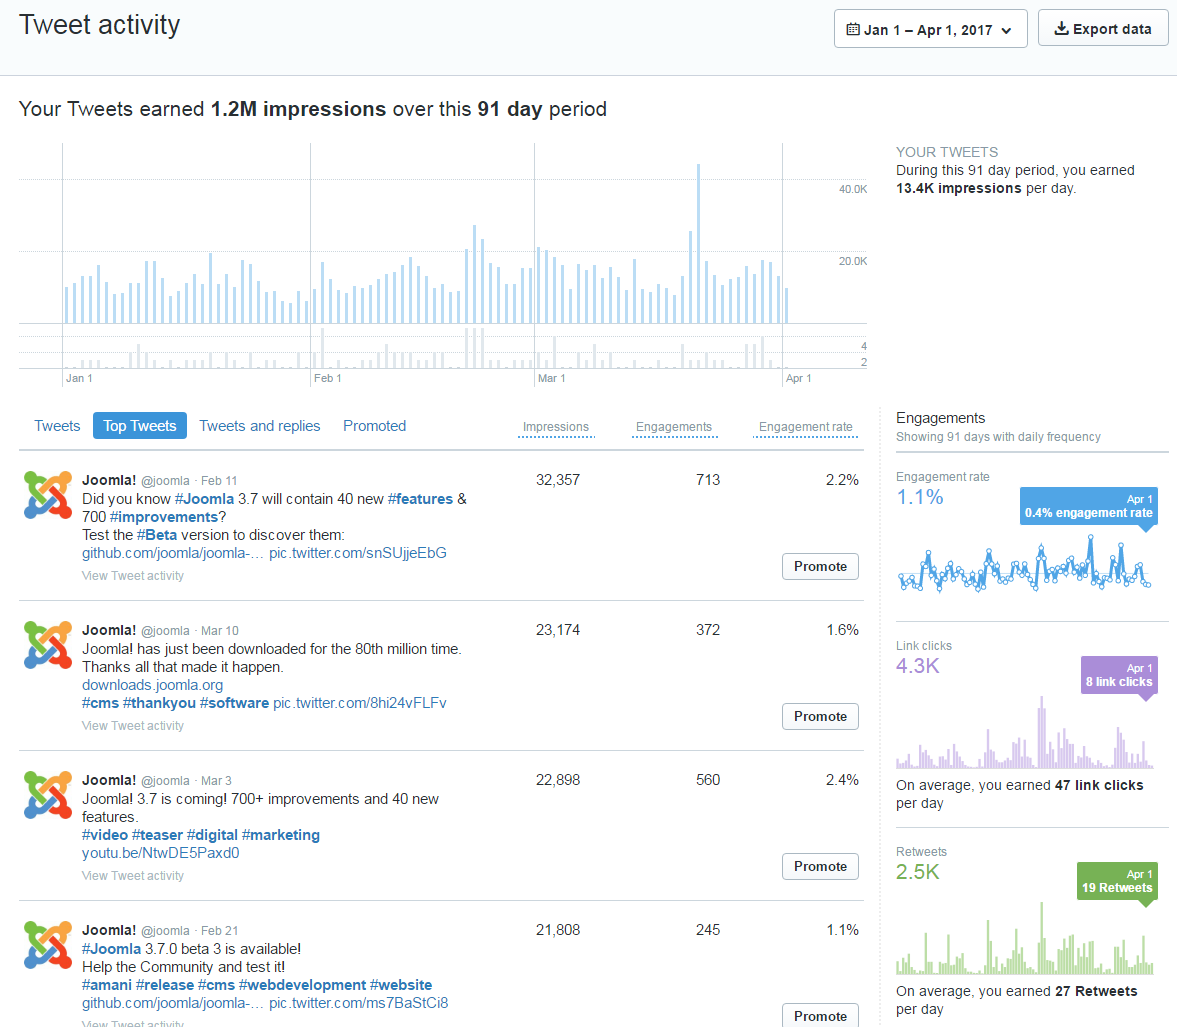
Below are the statistics of Facebook, Instagram, LinkedIn, Pinterest, Google+, Youtube and Twitter.
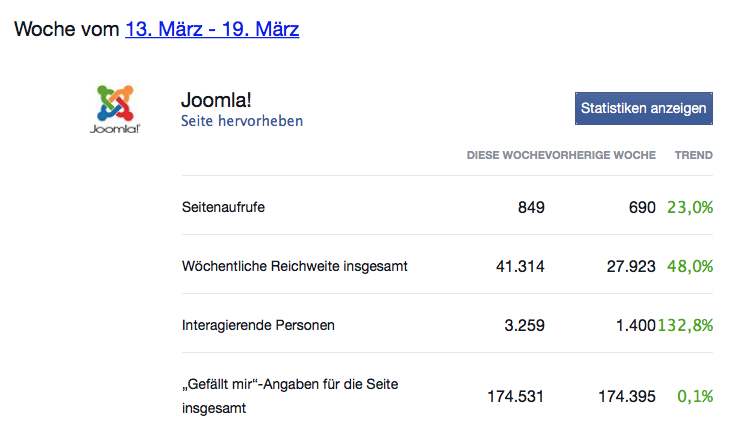


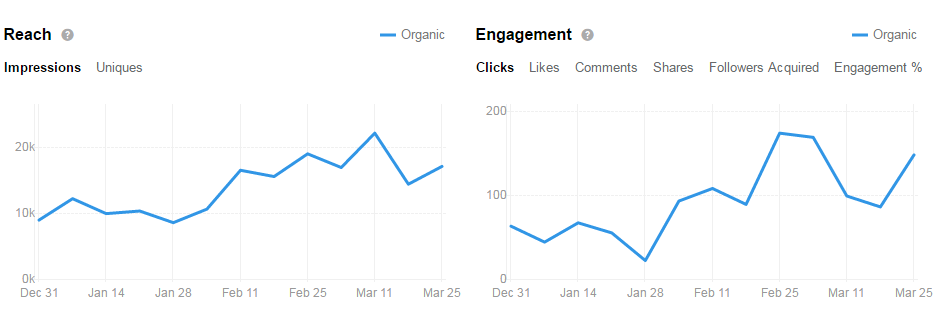
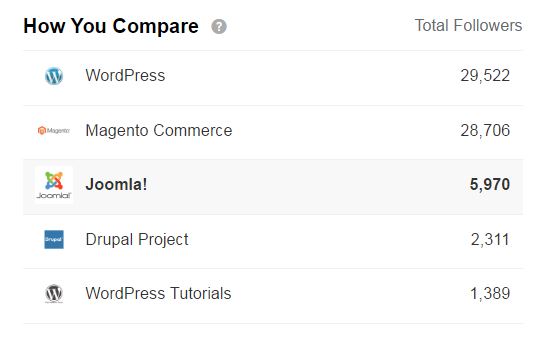
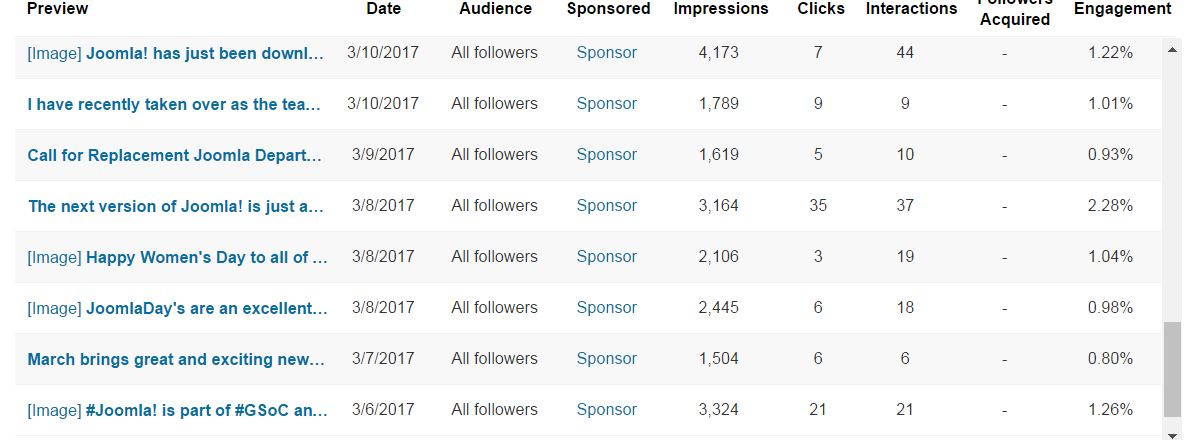
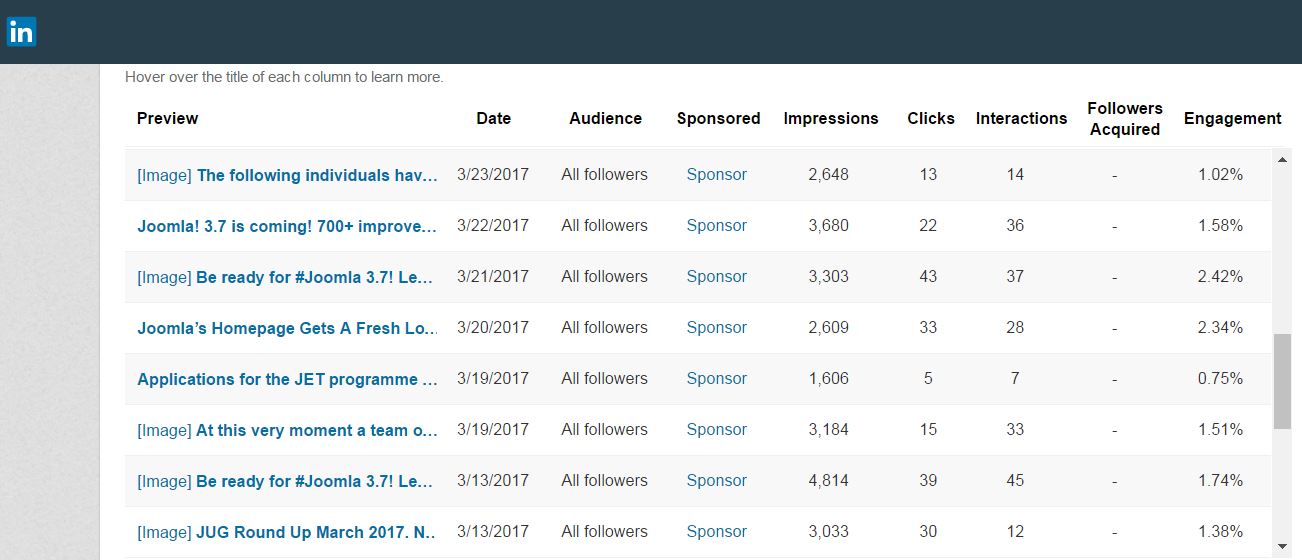
Top posts and interactions on LinkedIn in the past 30 days
Instagram does not provide statistics, so we’ve noted them manually.
January 2017
Account reactivated on December 30, 2016 (793 followers at that time - 4 posts)
(From 30 dec 2016)
-
9 new posts
-
+224 followers (1 017)
-
822 likes (average of 91/post) + 39 comments
-
Average of 552 views per post
February 2017
-
18 new posts
-
+123 followers (1 140)
-
1 852 likes (average of 103/post)
-
Average of 567 views per post
March 2017
-
16 new posts (incl. 2 reposts)
-
+136 followers (1 276)
-
1 991 Likes (average of 124/post)
-
Average of 652 views per post
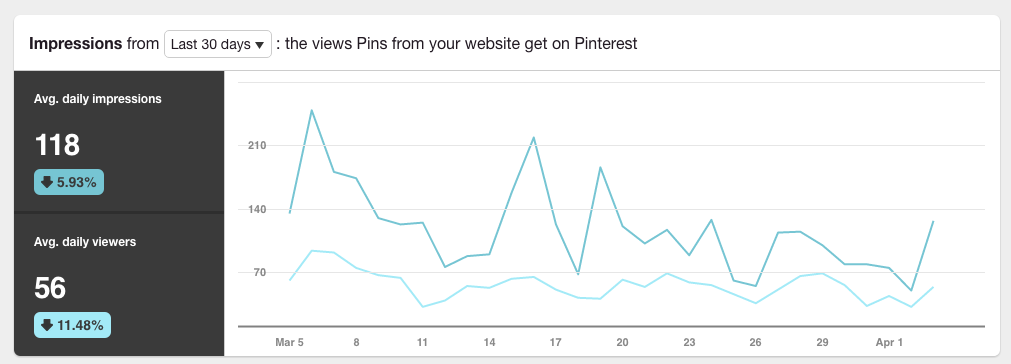
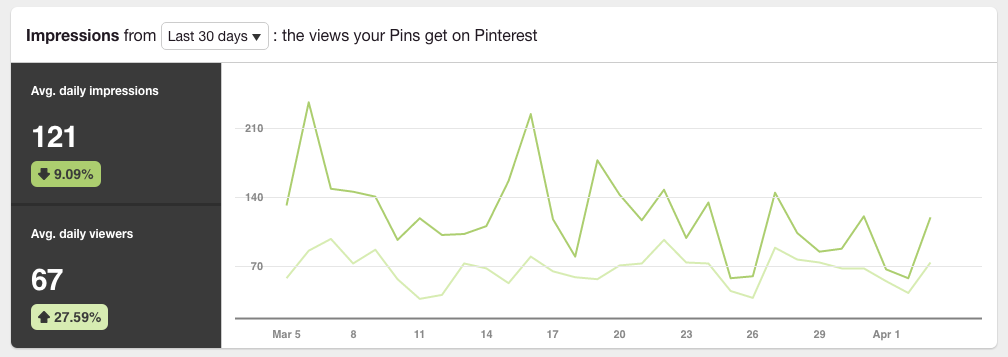
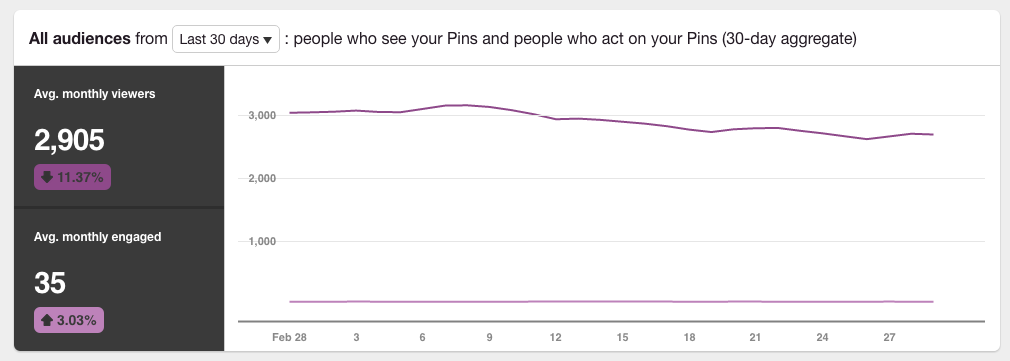
Pinterest
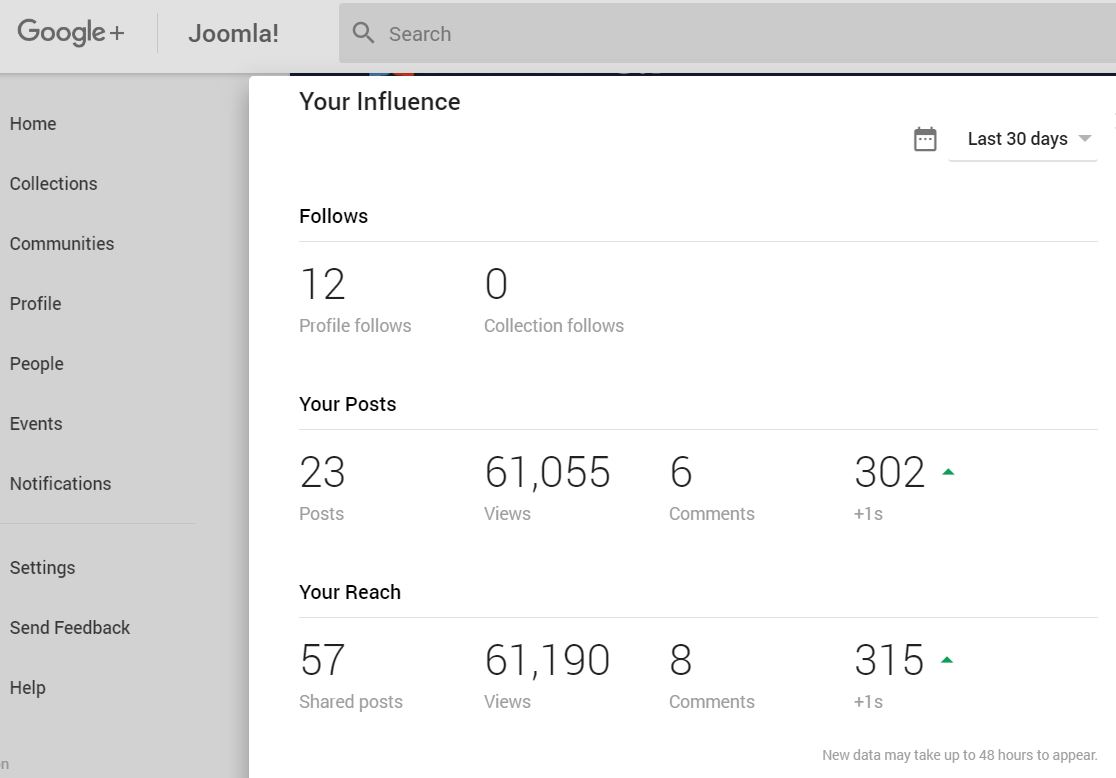
Google+
Past 30 days ending April 5th (G+ does not do bi-weekly stats)
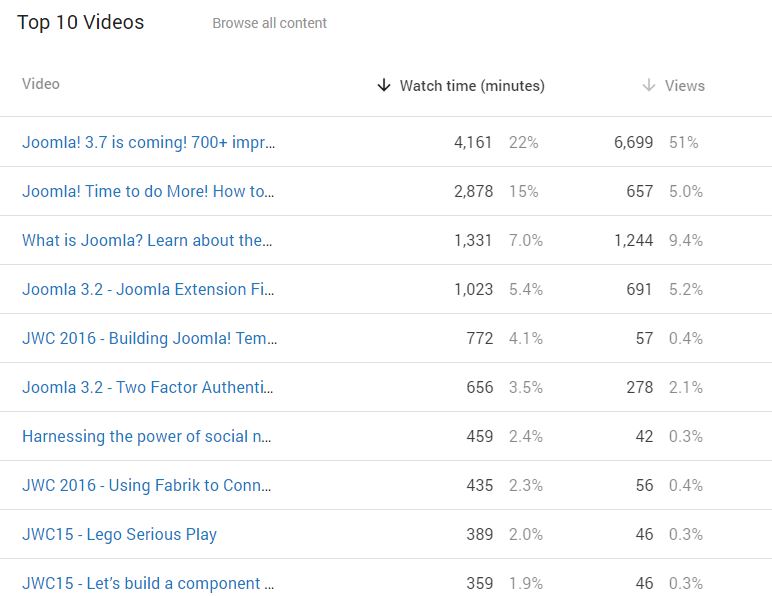
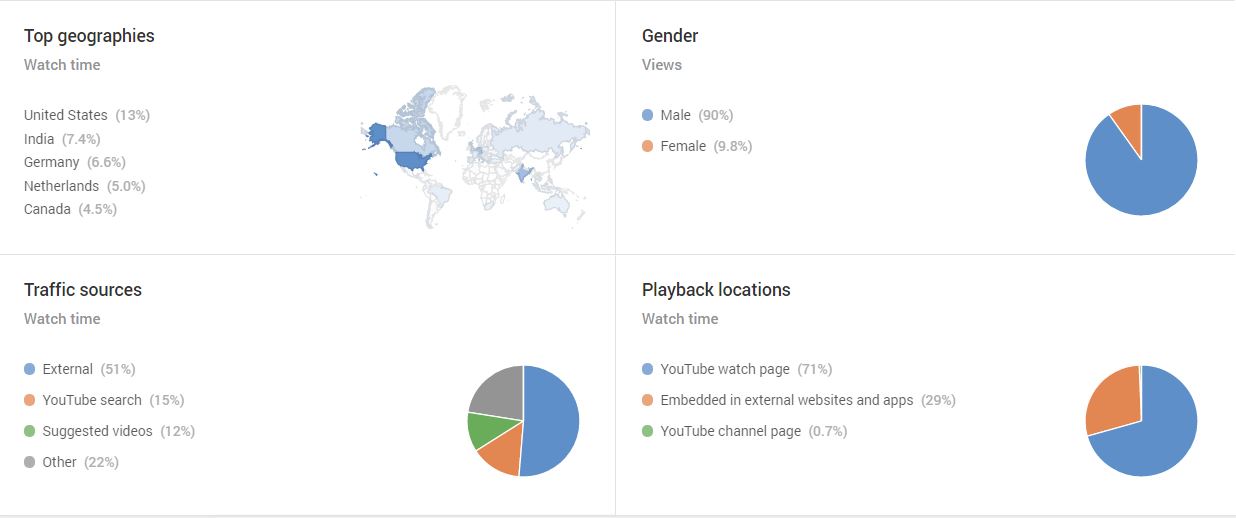
YouTube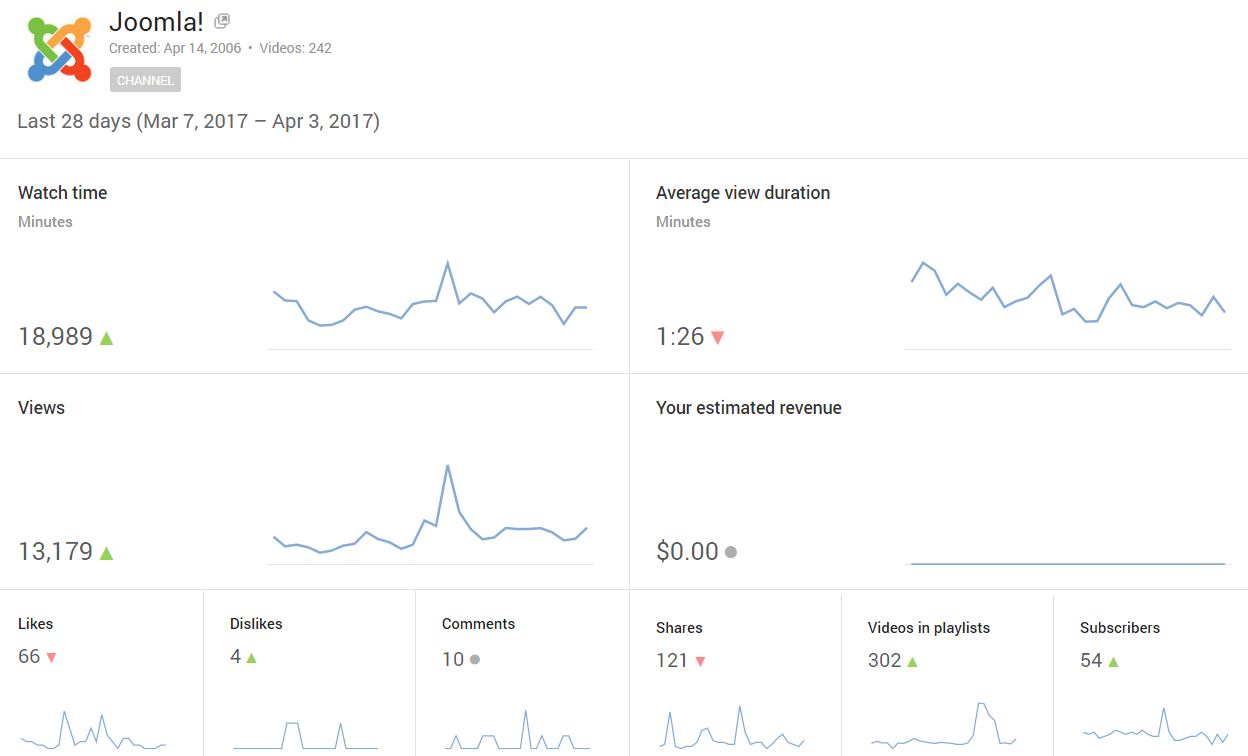
- You are here:
-
Home

-
Teams
-
Social Media Team
- Social Media Statistics January to March 2017